Aging Assets Not a Disadvantage
EP Editorial Staff | May 14, 2020

Study indicates that maintenance practices, not asset age, determine long-term asset performance.
By Jeff Dudley, Solomon Associates
Operators frequently indicate that the amount of equipment involved in a process, the complexity of the equipment, and asset age all have a significant impact on reliability and maintenance spending. While these assumptions appear correct, a deeper analysis reveals that none of these factors have a direct negative impact on asset performance.
Through its International Study of Plant Reliability and Maintenance (RAM) Effectiveness—a detailed comparative benchmarking study that focuses on the reliability and maintenance costs required to maintain a specific group of Process Family assets—we analyzed the strategy that drives reliability and maintenance spending and the resulting production loss. This production loss is monetized, and a value assigned to it.
The study is an ongoing effort that involves 8,000 process units in a database maintained by HSB Solomon Associates LLC, Dallas (solomononline.com). In the study, Process Family assets means that assets are evaluated against each other by like chemistries. When possible, assets that make similar end products are comparatively analyzed. In other cases, like chemistries with like assets are comparatively analyzed.
By evaluating which organizations can provide the mechanical availability required by their customers at an optimum cost, we calculate which organizations have the lowest RAM Effectiveness Index (EI). The 25% of assets in this lower range of RAM EI are owned by Top-Quartile (Q1) performers. The RAM Effectiveness Index is the sum of the monetized loss of production due to asset-driven downtime as a percentage of PRV (plant replacement value) and the total cost of routine and annualized turnaround spending, including end-of-life and replacement capital.
From this comparative analysis, we also know that the RAM EI is strongly driven by the type of culture that exists in the organization. We know this because we not only evaluated downtime and costs but also the organization’s maintenance strategy, i.e., the work processes, practices, and behaviors that are performed on a daily, weekly, and monthly basis to maintain reliable asset performance.
Aging Not a Disadvantage
Of the hundreds of metrics and comparisons that are addressed in the RAM Study, some metrics, such as equipment age, do not have as much impact as is commonly thought. If average performance for Q1 performers is analyzed, they indeed have less equipment, less complexity, and newer equipment. Unfortunately, if you stop the evaluation there, you will draw erroneous conclusions.

Since the correlation in Fig. 1 is linear, it implies that aging assets are disadvantaged. While the spread between Q1 and Q4 perforamance is an average of 13 years, the spread between the quartiles is six years from Q1 to Q2, three years from Q2 to Q3, and four years from Q3 to Q4. The RAM study includes a range of assets, from newly commissioned plants to plants that have operated more than 70 years. If age was a determining performance factor, the expectation would be that the average age differential between Q1 and Q4 performers would be much broader than 13 years and only roughly five years between quartiles. Since the average age of the quartiles shows a linear “disadvantage” with age, but not the magnitude expected, there must be factors, other than age, that affect RAM spending. By examining the study findings, we can evaluate what truly drives top performance.
Practices, Culture are Key
With 30 years of data to support our findings, we know that what differentiates top performers from average performers is not what they work on, but how they do their work. Top performers have proactive cultures and practices that allow them to perform at high levels of mechanical availability at optimum costs. The differentiating factor is not Process Family, complexity, equipment counts, or age, but the strategies used by organizations to keep their assets in good shape and operating at optimal levels.
If we look at this performance, it is obvious that their strategies are working. Q1 performers average at least a 2% mechanical availability advantage over all the other performers.

Let’s return to the age discussion. Fig. 2 focuses on the Q2 through Q4 organizations and the age of their assets. If age was a clear disadvantage, we would expect to see the difference between Q2 and Q3 performers be much more than an average three-year difference and the average between Q3 and Q4 performers to be more than four years.
If age was the driver, one would not expect a four-year difference in age to cause a 6% decrease in mechanical availability. Since age does not appear to drive mechanical availability issues, it has to be something else.

Consider the cost to operate these assets (Fig. 3). In the study, our normalization factor is plant replacement value (PRV). When cost performance by RAM EI is examined, you can see the inconclusive premise of age as a disadvantage.
If age was a critical issue, then the argument made above, comparing the quartile performance, would also apply. It wouldn’t make much sense that just because the Q4 assets are, on average, four years older than Q3 assets, they would require 1.5% more in maintenance spending on a PRV basis.
Mechanical availability and the spending to achieve optimal performance level appear to have very little to do with age as a driver across the quartiles. The only question left to ask is, if age is not a disadvantage, could it be an advantage for Q1 performers? Again, based on average age and the linear relationship between Q1 and Q4, could the fact that Q1 assets are an average of 13 years newer than Q4 assets be a possible advantage?
Best Practices Drive Reliability
What we know from the study is that Q1 performers are not the best performers because of things they can’t control—equipment age, asset counts, equipment complexity—but because of the things they do control. They have a culture that drives them to consistently perform best practices and, as a result, deliver the necessary mechanical availability to meet customer needs at an optimum maintenance spend, or RAM Effectiveness Index Q1 performance.
These best practices have nothing to do with the type or age of assets being maintained. They involve planning, scheduling and completion of work processes, and application of effective maintenance strategies.
The top performers are very proactive in the way they do maintenance:
• When necessary, they perform condition-based monitoring and asset intervention.
• They use time-based inspection strategies.
• They have effective, efficient turnarounds that are not budget constrained and carry out the necessary work to ensure assets run well during the non-turnaround periods.
• Their fixed equipment is treated with the same level of critical assessment as their rotating and instrument/electrical equipment.
• They have robust non-destructive testing techniques that allow them to monitor assets.
• They spend the optimum level on end-of-life asset replacement to keep their facilities in excellent condition.
• They have a firm foundational belief that assets, properly installed, maintained, and operated, will yield the best reliability.
• For Q1 performers, equipment age has no bearing on performance.
Maintenance Determines Performance
The data does show something about age. Why is it that Q1 average asset age is the lowest? The answer can also be demonstrated by looking at the best practices or lack of best practices performed by an organization. For example, assume two organizations install identical assets at the same time. Also assume that those assets are properly designed for their purpose. If operated for the same time period, it’s likely the assets will function without disruption.
At some point, companies that don’t follow maintenance best practices will see equipment age start to negatively affect performance. However, it is not asset age but the lack of asset maintenance over time that causes performance to deteriorate, creating a disadvantage for the operator.

A deeper look at the age data will put to rest any attempt to use it as an excuse. One factor is the age range in the different quartiles of performance. Figure 4 shows that the age range is very similar for Q1 through Q4 performers. In the RAM study, there are new plants with poor performance and old plants with very good performance. Age is not an advantage or disadvantage to the way assets perform. It’s asset maintenance that determines performance.
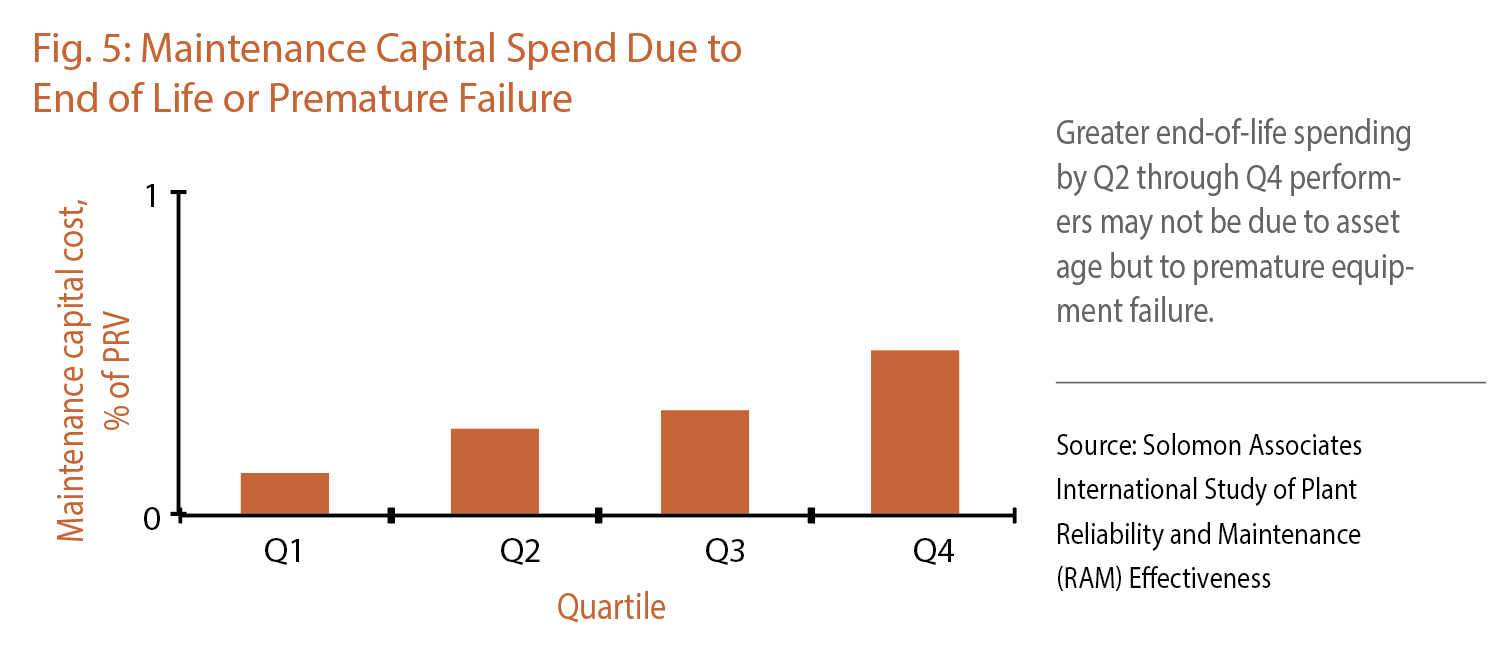
Even properly maintained equipment will eventually require end-of-life expenditures. If age was the only driver for all end-of-life spending, and the age range for the quartiles is similar, you would think all of the older plants would need to spend more on end-of-life issues. However, the data indicates greater end-of-life spending by Q2 through Q4 performers may not be due to asset age but to premature equipment failure (Fig. 5). It would follow that the bulk of this spending is the result of poor maintenance practices. With an average age difference of only 13 years from Q1 to Q4 and a similar range in age of assets in those quartiles, you would not expect a five-fold difference in maintenance capital spending.
No Excuses at Q1
Q1 organizations work very hard to create a proactive culture in which practices, behaviors, and work processes drive performance. They also do not look for excuses to defend performance. As a result, they deliver sustainable top performance.
The bottom line is, if an organization is not prepared to conduct best practices and implement robust equipment-reliability strategies, their new equipment may be advantageous to their performance for only a brief period of time. Ultimately, a company’s lack of proactive reliability culture, not the age of their assets, will be the root cause of their poor performance. EP
Jeff Dudley has 40 years of experience in the chemical-manufacturing industry as an operations leader and recognized practitioner of developing reliability-based cultures. He is currently a Senior Consultant for Solomon Associates, Dallas, solomononline.com, where he uses the Solomon RAM benchmarking study to help clients develop business strategies to improve customer loyalty, employee engagement, and profitability.
POPULAR CATEGORIES
FEATURED VIDEO
-
Featured Video

 VIDEO: Pros And Cons Of Condition Monitoring Services
Brent Nelson is the Director of Product Development for Industrial Services for Donaldson, Bloomington, MN (donaldson.com), a global manufacturer of filtration products and solutions, is our guest for this […]


View Comments