Anatomy Of An Oil Analysis Report
EP Editorial Staff | February 10, 2021

The various components of an oil-analysis report will provide you with considerable knowledge about asset operating conditions.
By Mark Barnes, PhD CMRP, Des-Case Corp.
Oil in a machine is often compared to the blood in our body, and for good reason. Our blood provides numerous benefits, including delivering oxygen and nutrients to tissue, carrying antibodies, and heating/cooling the body. Machine oil also performs multiple functions, including reducing friction, controlling temperature, providing additives, and helping to control and remove contaminants. As with our blood, when something goes wrong with a machine, the symptoms of failure often manifest themselves in the oil.
In the medical field, we use blood samples to perform body condition monitoring. In the industrial world, we use an oil samples. Used correctly, oil analysis is a predictor of imminent failure and a prescriptive tool, used to guide decisions about lubricant selection and application, oil change-out intervals, preferred storage and handling practices, and contamination-control strategy.
Elemental Analysis
All oil-analysis reports start by listing 20 to 30 elements. They range from common metals, such as iron, lead, tin, and copper, found in oil-wetted components; to additive elements such as zinc, calcium, and phosphorus, found in certain types of oils; to common contaminants such as silicon (dirt), and sodium (coolant or sea water). Like all oil-analysis tests, elemental analysis results should be trended over time.
While element analysis is fundamental it should be used judiciously because the analysis procedure has limitations that affect the results. Perhaps the most significant limitation is particle size. Most modern labs use inductively coupled plasma (ICP) spectrometers to report elements. This method cannot measure particles larger than 3 microns. As such, large-particle contamination, or wear modes, such as adhesive wear, may not be accurately reported through ICP. In fact, it’s entirely possible for a gearbox to be experiencing severe scuffing wear but for ICP to report little to no iron or other wear metals.
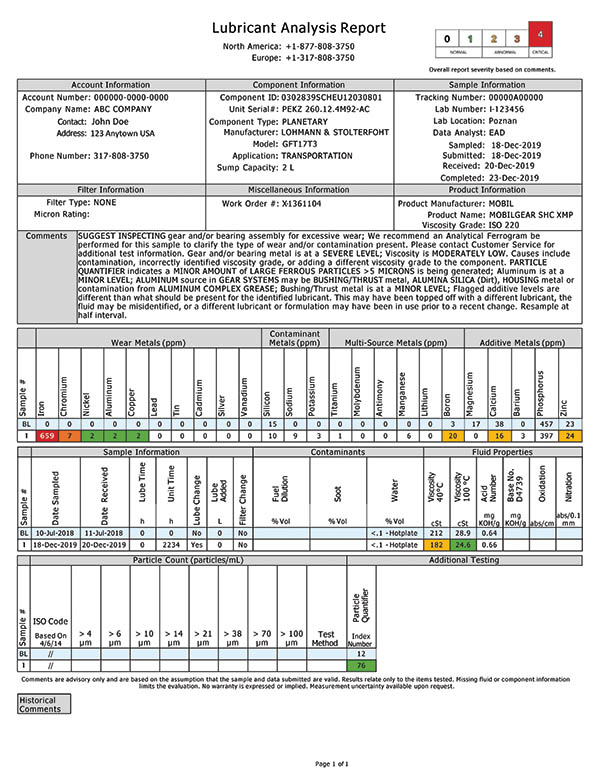
Evaluating oil-analysis report information, such as viscosity, wear metals, particle counts, and water contamination, will go a long way toward full understanding of conditions that are affecting machine operations. Photo courtesy Polaris Laboratories, Indianapolis
(polarislabs.com)
Particle Quantifier Index
In assets, such as gearboxes, common failure modes lead to large (>5 micron) wear particles. With these assets, particle quantifier (PQ) testing should be routine. The test uses the magnetic Hall Effect to determine the concentration of ferromagnetic particles in the sample, regardless of size. Trending an oil’s PQ Index over time can provide valuable information about incipient failures. Other tests, such as direct-read ferrography, are also capable of measuring large wear particles. The PQ test, however, has become an industry standard due to its relative simplicity and low cost. Note that the PQ test cannot detect non-ferrous wear or non-magnetic forms of iron such as rust particles.
Viscosity
Viscosity is the most important property of any lubricant, so it makes sense to measure an oil’s viscosity as part of any routine oil analysis. Viscosity is usually reported at 104 F (40 C) for industrial oils and 212 F (100 C) for automotive-grade oils, though measuring at both temperatures is better. With the two numbers, an oil’s viscosity index, or rate of change with temperature,
can be calculated.
In engine-oil samples, viscosity can help determine if the oil is still within grade and is a good indicator of fuel dilution. In industrial fluids, viscosity testing is less useful. The rate of change of an industrial oil’s viscosity over time is far less pronounced. Typically, viscosity will not change until an oil has less than 10% of its remaining life; long after sludge, varnish, and other deposits start to form. Viscosity testing of industrial fluids is really about ensuring that the correct oil grade is in use and that cross contamination has not occurred.
Acid and Base Numbers
Acid- and base-number testing, sometimes collectively referred to as neutralization numbers, measures the acidity or alkalinity of a sample. Acid Number (AN) measures the buildup up of acid byproducts. It’s often related to oxidative decay. As such, it is one indicator that can be used to gauge oil health. In engine applications, particularly natural-gas engines, an oil’s AN can also be used to measure the presence of acidic combustion byproducts.
Base Number (BN) is used almost exclusively for engine-oil analysis. The test measures the amount of over-base detergent additives in the oil. While historically it’s been used to measure additive health to facilitate condition-based engine-oil changes, the BN test has become slightly less important with the adoption of low and ultra-low sulfur fuels. AN and BN tests require a representative new oil reference for comparison.
Water
Water is an insidious contaminant that can cause rust and corrosion, as well as alter oil-film thickness. As such, detecting water in an oil sample and controlling moisture ingress is an important consideration.
There are several water-test techniques, ranging from a simple hot plate test commonly known as a “crackle test,” to sophisticated methods, such as Karl Fischer (KF) analysis. Since oils are hydroscopic, all samples will show some water contamination. The key is to measure and control water levels below the saturation point at all in-service oil temperatures. In practical terms, this means less than 100 ppm for turbine-type oils, less than 150 ppm for hydraulic fluids and other oils with AW additives, and less than 250 ppm for gear oils.
Because of these relatively low detection limits, the most reliable test method is the KF method. For very low levels and/or very accurate results, the co-distillation method of KF testing should be used to avoid additive interference.
ISO Particle Counting
Depending on applications, most lubrication experts recognize that anywhere between 50% and 80% of lubrication-related problems are directly or indirectly due to particle contamination. Because of this, ISO particle counting should be routine on all samples, perhaps with the exception of engine-oil samples. A test report should count particles in three size ranges: >4 microns, >6 microns, and >14 microns, based on the ISO 4406 reporting standard.
While several methods can be used to determine an oil’s ISO particle count, most labs use optical-laser particle counters. Caution should be exercised when interpreting ISO particle counts from optical counters since interferences such as water, “soft” particles from oil degradation, and additive “floc” can affect the reported ISO codes.
Alongside vibration analysis, thermography, and ultrasonic testing, in-service oil analysis is an integral part of a proactive condition-monitoring strategy. Like any test measurement, the diagnosis is only as good as the data. Make sure you take time to learn the “language” of oil analysis, visit your lab to ensure their methodologies are up to date and accurate and, most of all, ensure that the sample you send to the lab is taken from the right location and is representative of the oil that’s lubricating the components. EP
Mark Barnes, CMRP, is Senior Vice President at Des-Case Corp., Goodlettsville, TN (descase.com). He has 21 years of experience in lubrication management, oil analysis, and contamination control.
POPULAR CATEGORIES
FEATURED VIDEO
-
Featured Video

 VIDEO: Pros And Cons Of Condition Monitoring Services
Brent Nelson is the Director of Product Development for Industrial Services for Donaldson, Bloomington, MN (donaldson.com), a global manufacturer of filtration products and solutions, is our guest for this […]


View Comments