Metrics Key To Sustainable Success
EP Editorial Staff | April 8, 2021

Use the SMART approach to establish KPIs that will improve your lubrication practices.
By Mark Barnes, PhD, CMRP, Des-Case Corp.
Lord Kelvin, famed for his 19th century pioneering work in thermodynamics and electrical engineering, is reputed to have said, “If you can’t measure it, you can’t manage it.” In today’s data-driven world, that statement is even more true than in Lord Kelvin’s time. Measurements, however, only get us so far. To have true meaning, we need a comparison to decide whether a measurement is good or bad, high or low. This is where metrics come into play.
Metrics, often referred to as Key Performance Indicators (KPI), are designed to provide meaning to performance measurements and indicate whether we should take corrective action.Designed correctly, KPIs should follow the SMART principle:
Strategic: Does the metric align with overall business goals and objectives?
Measurable: Can we easily and accurately capture the data that’s required to trend performance?
Actionable: If a KPI is found to be out of compliance, is there a simple correction?
Reasonable: Are the KPIs achievable and realistic?
Timely: Are the KPIs lagging or leading indicators and do they provide enough time to take correct action?
Having worked with organizations that had very few KPIs and others that seemed to be swimming in numbers, I can attest that metrics can create stress in any organization. Stress is not always bad. While we’re all familiar with distress, which can create feelings of hopelessness and despair, eustress, which is the opposite of distress, can create engagement, drive, and tenacity.
Asset management
In asset management, KPIs are everywhere, usually with a catchy three- or four-acronym label such as MTBF, MTTR, or OEE. In the field of lubrication, few organizations have truly developed SMART KPIs to drive sustainable best-in-class performance. Without strategic KPIs, many lubrication programs drift in a current of apathy, without clear direction or consistency of effort.
Put simply, precision lubrication is about using the correct lubricants in the right amount and ensuring that the lubricant is clean, dry, cool, and has not degraded, while constantly being cognizant of safety and environmental responsibility. As such, lubrication metrics need to measure these important aspects for long-term success.
Right lubricant, right condition
Oil analysis is a critical tool for establishing lubrication metrics since it measures the health of the lubricant and the degree to which degradation has occurred. Viscosity, acid number, and elemental additive composition are routine tests that can be combined into one metric we might refer to as “lubricant condition.”
Used as a metric, lubricant condition can be calculated as the number of samples that come back flagged with issues related to lubricant health, divided by the total number of samples. While the goal should be 100% compliance, setting a target of 95% is a good starting point.

PM compliance
Once proper lubrication PMs have been established, ensuring that routine lubrication tasks, such as re-greasing, oil changes, and basic inspections, are done in a timely fashion is just as important as using the right lubricant. To measure this, a standard metric called “lubrication PM compliance” should be established.
Lubrication PM compliance, which measures the on-time completion of time-based lubrication tasks, should be tracked on a monthly basis as the ratio of the number of PM tasks completed on-time versus the total number of lubrication PMs in a given month. Again, our goal should be 100%, with 90% compliance a good starting point.

Environmental compliance
Increasingly, companies seek to ensure that operations and maintenance are focused on sound environmental practices. In the lubrication world, this means that we are constantly striving to use less oil by identifying and correcting leaks, while ensuring that we can account for every gallon of oil used. In some industries, such as mining MHSA, these practices have been in place for many years, but will soon be mandatory in most industries.
For precision lubrication, there are two environmental metrics we should track. The first is simply a total count of the number of gallons of oil or pounds of grease used each year. Depending on past practices, a reasonable goal might be to see a 5% to 10% reduction, year-on-year, of the total amount of oil or grease used. Not only does this demonstrate a commitment to good environmental stewardship, the cost savings can also be used to help justify investments in other aspects of the lubrication program.
At least in North America, many companies have implemented very strict environmental policies, either as part of an ongoing sustainability program or as part of a broader regulatory compliance, such as ISO14001. To ensure that lubrication is meeting this standard, a very simple metric that measures lubricant consumption versus disposal can be used.
This “lubrication sustainability” metric is the ratio of the number of gallons of oil that have been safely and correctly disposed of, versus the total number of gallons received. Many companies set very strict guidelines such as 97% to 98% compliance for lubrication sustainability.

Contamination-Control Compliance
Since anywhere from 60% to 80% of lubrication-related machine failures are tied to contamination, it makes sense to adopt metrics that measure fluid cleanliness and moisture content. Once again, oil analysis provides the raw data to compile monthly metrics. Since every type of machine has different contamination tolerances, we need to start by assigning dryness and cleanliness targets using the ISO4406 standard.
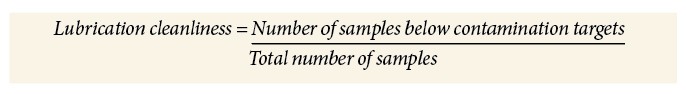
This can be done on a machine-by-machine basis or, perhaps easier, by overall asset class. Asset class simply means similar machines in similar applications. For example, all centrifugal pumps in the Chem Prep Area or all hydraulics in the Finishing Line. Once dryness and cleanliness targets have been established, a monthly “lubrication cleanliness” metric can be established as the ratio of samples that are at or below the required target level, versus the total number of samples submitted. A good starting point for this metric is 90%, provided the targets have been set reasonably.
Prominently Post Metrics
For metrics to have meaning, charts and graphs need to be posted prominently in the maintenance shop, lube room, and other common areas. Doing so helps personnel understand what factors are important and instills a sense of pride and competitiveness, ensuring that everyone is striving to make lasting improvements.
Of course, in all organizations, there are always those who are resistant to change. To overcome this, I’ve always reverted to peer pressure by recommending the use of “bad actor” lists that are distributed by area or department. It’s amazing to see the mindset change when the same bad actors appear prominently posted on the notice board each month. In any reliability-driven maintenance culture, continuous improvement is key. Put a few simple metrics in place and see how quickly the competitive spirit kicks in to put you on track to precision lubrication. EP
Mark Barnes, PhD, CMRP, is Senior Vice President at Des-Case Corp., Goodlettsville, TN (descase.com). He has 21 years of experience in lubrication management, oil analysis, and contamination control.
POPULAR CATEGORIES
FEATURED VIDEO
-
Featured Video

 VIDEO: Pros And Cons Of Condition Monitoring Services
Brent Nelson is the Director of Product Development for Industrial Services for Donaldson, Bloomington, MN (donaldson.com), a global manufacturer of filtration products and solutions, is our guest for this […]


View Comments